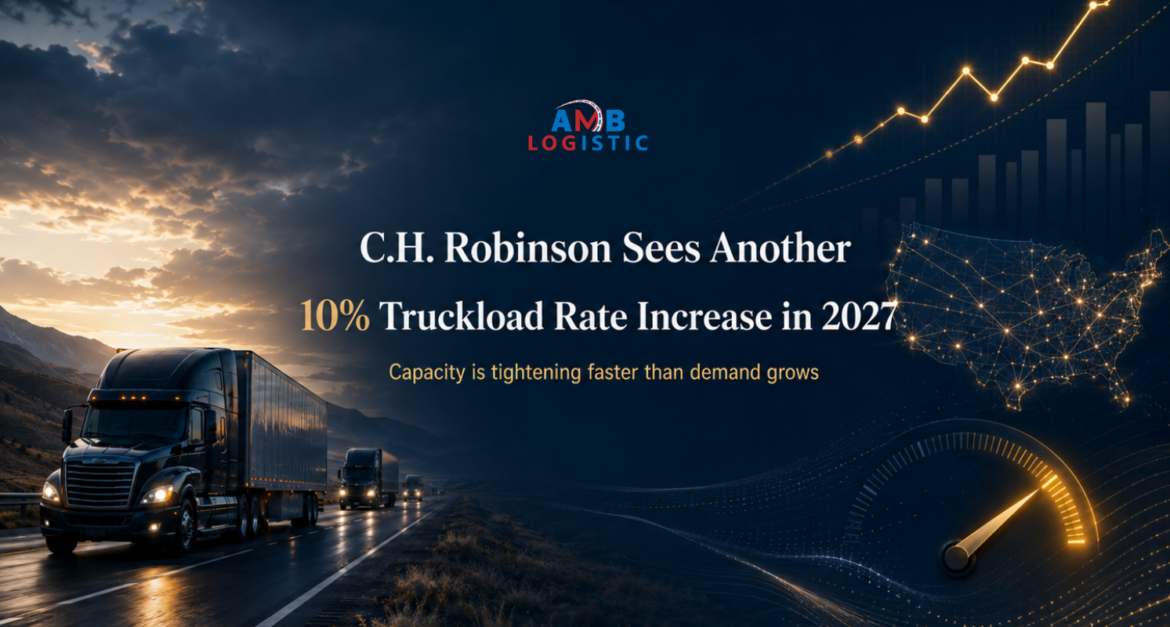
C.H. Robinson’s September 2026 freight-market outlook delivers a clear message for shippers and freight brokers:
Do not plan 2027 around cheaper truck capacity.
The company projects dry van and flatbed costs per mile will rise approximately 10% year over year in 2027, while refrigerated truckload costs could climb approximately 11%.
This forecast does not depend on a major freight boom. Its central argument is simpler—and potentially more challenging for brokers: trucking capacity is contracting faster than freight demand is growing.
That equation can produce higher rates even in a quiet market.
Key Takeaways
- 2027 forecast: Dry van +10%, refrigerated +11%, and flatbed +10% year over year.
- Revised 2026 forecast: Dry van +30%, refrigerated +31%, and flatbed +28%.
- The 2026 projections were reduced slightly after spot rates cooled from their early-July peak.
- The adjustment represents seasonal easing—not a return to widespread excess capacity.
- Carrier closures, insurance expenses, driver restrictions, and enforcement are contributing to capacity contraction.
- Loads traveling more than 600 miles are experiencing route-guide failures at more than twice the rate of shorter shipments.
- The largest year-over-year increases are expected during the first half of 2027 before moderating later in the year.
The 2026–2027 Forecast at a Glance
| Equipment | 2026 vs. 2025 | 2027 vs. 2026 |
|---|---|---|
| Dry Van | Approximately 30% higher | Approximately 10% higher |
| Refrigerated | Approximately 31% higher | Approximately 11% higher |
| Flatbed | Approximately 28% higher | Approximately 10% higher |
The 2026 dry van and refrigerated forecasts were reduced slightly because spot rates have cooled since early July.
That is seasonal relief, but it is not evidence that the market has suddenly become oversupplied. Capacity is still leaving faster than it is returning, giving the transportation system less room to absorb disruptions.
These figures are forecasts—not guarantees. Fuel prices, weather, regulations, economic conditions, and freight demand could change the final results.
However, the direction remains important:
Brokerages should not build their 2027 pricing strategies around the assumption that capacity will become easier or cheaper.
Why Rates Can Rise Without a Demand Surge
Truckload rates rise when freight volume grows faster than available capacity. They can also rise when capacity contracts while demand remains relatively stable.
That second scenario is driving the current market.
Capacity continues leaving for several reasons:
- Carrier bankruptcies and business closures.
- Rising insurance premiums and deductibles.
- Higher maintenance and equipment expenses.
- Stricter driver requirements.
- Increased enforcement activity.
- A smaller pool of experienced drivers.
- Limited access to affordable working capital.
- Weak profitability among smaller fleets.
- Expanding cargo-theft and fraud exposure.
At the same time, carriers are not rushing to add trucks.
Many fleets are prioritizing better utilization, dedicated freight, repeatable lanes, and dependable round trips instead of pursuing speculative expansion.
This keeps the truck population lean even when freight demand strengthens seasonally.
Insurance Deserves Special Attention
Insurance premiums and deductibles are rising quickly, particularly for smaller fleets where one serious claim can transform the next renewal.
Those higher expenses eventually appear somewhere in the transportation market through:
- Higher carrier rates.
- Additional carrier closures.
- Reduced fleet expansion.
- Deferred equipment replacement.
- Tighter carrier-selection standards.
- Greater preference for predictable contract freight.
Each outcome reduces the amount of dependable capacity a freight broker can access.
Driver Supply Tells the Same Story
Enforcement activity, stricter licensing standards, and competition for experienced drivers are limiting the number of drivers carriers can hire.
A registered truck does not automatically represent usable capacity. If the carrier cannot assign a properly qualified driver, that truck cannot move the load.
This is why total registered equipment can create a misleading picture of real market capacity.
The result is a market that may appear calm during an ordinary week but still contain very little excess capacity. A holiday, hurricane, enforcement campaign, or harvest can expose that weakness in a matter of days.
Spot Rates Cooled After July—Capacity Did Not Come Back
Truckload rates have moved below their early-July peak as seasonal pressure declined and consumer spending remained uneven.
That provides genuine short-term relief for brokers and shippers. It does not mean the capacity problem has been resolved.
A market with less available capacity becomes more sensitive to relatively small disruptions, including:
- Severe weather and hurricane evacuations.
- Produce harvests.
- Holiday freight.
- Enforcement campaigns.
- Fuel-price spikes.
- Port or rail disruptions.
- Sudden retail promotions.
- Year-end inventory movements.
When capacity is abundant, the market can absorb these events without major pricing changes.
When capacity is limited, the same events can quickly produce tender rejections, regional equipment shortages, and spot-rate increases.
The market is experiencing seasonal cooling—not a structural restoration of excess capacity.
Route Guides Reveal Where the Pressure Is Concentrated
In August, average North American route-guide depth improved to approximately 1.35, reflecting calmer conditions than those experienced during June and July.
However, that overall average hides a significant difference based on shipment distance:
- Loads traveling more than 600 miles: Approximately 8.5% weekly route-guide failure rate.
- Loads traveling less than 400 miles: Approximately 3.6% weekly route-guide failure rate.
Long-haul freight requires carriers to evaluate more than loaded mileage. Their decisions may depend on:
- Total driver hours.
- Destination-market strength.
- Reload availability.
- Weekend exposure.
- Empty repositioning.
- Fuel consumption.
- Delivery appointments.
- Driver home-time requirements.
- Several days of equipment utilization.
A regional load may return the truck to a familiar market quickly. A long-haul shipment can position the same equipment in an undesirable destination and consume several operating days.
That is why national conditions can appear stable while particular long-distance lanes become tighter and more expensive.
Segment-by-Segment Outlook
Dry Van
Dry van represents the largest section of the U.S. truckload market, serving retail, food and beverage, manufacturing, automotive, packaging, building materials, e-commerce, and general merchandise.
Dry van costs are forecast to finish 2026 approximately 30% above 2025 levels, followed by another increase of approximately 10% in 2027.
The market is not being driven by uniformly strong demand. Instead, supply contraction is creating a firmer pricing foundation.
Carriers increasingly prefer:
- Dedicated freight.
- Repeatable lanes.
- Round-trip opportunities.
- Consistent shipment volume.
- Low-detention facilities.
- Predictable appointment schedules.
Brokerages should expect a widening price difference between freight that fits carrier networks and transactional loads involving poor lead time, weak destinations, or difficult facilities.
Refrigerated
Refrigerated truckload costs are forecast to rise approximately 31% in 2026 and another 11% in 2027—the highest projected 2027 increase among the three major equipment categories.
Northern harvest activity involving potatoes, onions, sweet corn, apples, cherries, and other produce has tightened capacity across several markets.
In some northern areas, outbound load-to-truck ratios have reached two to three times their early-summer levels, while certain markets have experienced double-digit spot-rate increases.
Southern markets are moving in the opposite direction. As growing seasons conclude, freight volumes are declining, capacity is becoming easier to secure, and pricing is softening.
A national refrigerated rate can therefore hide a market that is extremely tight in one region and relatively soft in another during the same week.
Accurate refrigerated pricing requires:
- Harvest timing.
- Origin-market capacity.
- Destination reload data.
- Temperature requirements.
- Washout requirements.
- Appointment schedules.
- Product shelf life.
- Claims exposure.
Flatbed
The September outlook includes C.H. Robinson’s first formal flatbed forecast.
Flatbed costs are projected to finish 2026 approximately 28% above 2025 levels and rise another 10% during 2027.
Demand remains supported by manufacturing, data-center construction, energy infrastructure, industrial development, steel and machinery movements, and renewable-energy projects.
Residential construction remains relatively weak, limiting demand for certain building products. However, industrial investment is helping provide a stronger foundation for flatbed activity.
Flatbed spot linehaul rates declined approximately 1.6% month over month in July to around $2.90 per mile. Even after that decline, pricing remained elevated compared with recent historical conditions.
Flatbed rates also depend heavily on shipment-specific requirements:
- Dimensions and weight distribution.
- Tarping and securement.
- Permits and escorts.
- Specialized trailers.
- Loading and unloading equipment.
- Jobsite access.
A national flatbed average should be treated as a reference—not a final quote—until the equipment and operating requirements are confirmed.
What This Means for a Brokerage’s Book of Business
Fixed Customer Rates Can Fall Behind Carrier Costs
A broker may agree to a fixed customer rate based on current market conditions. If carrier costs rise during the contract period, the brokerage absorbs the difference.
The greatest exposure often appears on lanes with limited carrier depth, unclear accessorial policies, inconsistent volume, difficult facilities, long-distance requirements, or freight originally won at an unsustainably low price.
Brokerages should model several market scenarios before committing to long-term pricing.
Margins Can Compress During a Tightening Market
A tightening freight market does not automatically produce stronger brokerage margins. Carrier prices may increase before shipper rates adjust.
The broker must understand:
- Current customer revenue.
- Expected carrier cost.
- Minimum acceptable margin.
- Recovery cost if the original carrier cancels.
- Accessorial exposure.
- Customer credit risk.
- Claims and fraud exposure.
Higher shipment volume means little if the freight cannot be moved profitably.
Service Failures Become More Expensive to Prevent
Last-minute shipments usually experience capacity pressure first.
A shipper providing one or two days of lead time may receive a very different result from one providing five to seven days.
Brokers should encourage customers to tender freight earlier, provide accurate forecasts, maintain flexible appointment windows, reduce detention, confirm shipment details, and communicate changes immediately.
These actions can create a measurable capacity advantage.
The 2027 Playbook: Seven Moves for Freight Brokers
1. Rebuild Pricing Discipline
Review core lanes before committing to new contract rates. Analyze recent carrier costs, tender-rejection history, seasonal patterns, equipment availability, fuel assumptions, facility performance, and expected 2027 cost drivers.
Quote-validity periods should match actual market volatility.
2. Deepen Carrier Relationships Before Capacity Tightens
A large carrier database is not the same as usable capacity.
Develop verified primary and backup carriers for important lanes before the market becomes urgent. Carrier loyalty is built through consistent volume, accurate information, fair accessorial treatment, reliable payment, fast issue resolution, and respect for driver time.
3. Price the Entire Truck Movement
Loaded mileage does not represent the carrier’s complete operating cost.
Consider origin deadhead, destination repositioning, reload availability, fuel, tolls, detention, layovers, weekend timing, driver hours, and equipment requirements.
4. Give Long-Haul Freight Special Handling
With long-haul route-guide failures running substantially above short-haul freight, loads over 600 miles require additional planning.
This may include earlier tendering, preferred-carrier commitments, flexible scheduling, destination planning, proactive tracking, and backup capacity identified before pickup.
5. Read Local Conditions—not Only National Averages
A national forecast provides strategic direction, but trucks are purchased in specific markets.
Combine broader data with regional load-to-truck ratios, carrier conversations, weather, harvest activity, manufacturing demand, available truck counts, and destination conditions.
6. Keep Verification Non-Negotiable
Tighter capacity creates pressure to approve unfamiliar carriers quickly. That pressure must not weaken verification.
Before assignment, confirm operating authority, insurance, carrier identity, verified contact channels, driver identity, tractor and trailer information, dispatch authorization, pickup instructions, and tracking capability.
7. Prepare Customers Before the Market Moves
Explain which lanes face the greatest exposure, why long-haul freight requires more planning, how lead time affects capacity, why detention reduces carrier interest, and when pricing must be refreshed.
A customer who understands the market before disruption occurs is easier to support when conditions tighten.
Frequently Asked Questions
Are truckload rates guaranteed to rise 10% in 2027?
No. These figures are forecasts and may change based on fuel prices, regulations, weather, capacity, economic conditions, and freight demand. They should be treated as planning signals—not guarantees.
Why could rates rise without strong freight demand?
Rates reflect the balance between freight demand and available capacity. If capacity contracts faster than shipment demand, rates can increase without a major freight boom.
What are the 2027 forecasts by equipment type?
Dry van and flatbed costs per mile are projected to rise approximately 10% year over year. Refrigerated truckload costs are projected to rise approximately 11%.
Why are long-haul loads experiencing more route-guide failures?
Long-haul shipments require more driver time and expose carriers to destination, reload, fuel, scheduling, and repositioning risks. Carriers may reject loads that do not fit their operating networks.
Does the decline from July’s spot-rate peak mean capacity has returned?
Not necessarily. The decline reflects seasonal cooling, but the underlying forces removing capacity remain active.
How can shippers prepare?
Shippers can tender earlier, provide accurate forecasts, improve facility efficiency, reduce detention, and maintain flexible appointment windows.
How can brokers protect their margins?
Brokerages should refresh pricing regularly, model future carrier costs, define quote-validity periods, monitor lane-level conditions, and avoid freight that cannot be moved safely and profitably.
Should brokers raise every customer rate immediately?
No. Pricing decisions should reflect the specific lane, equipment, shipment volume, service requirements, and available capacity. The forecast should support informed planning—not indiscriminate increases.
The Bottom Line
Spot rates may be calmer than they were in July, but the forces removing capacity from the market have not disappeared.
Carrier failures, insurance inflation, driver restrictions, enforcement activity, and cautious fleet growth continue limiting available truck supply.
If capacity contracts faster than freight demand grows, rates can continue increasing without a major economic recovery.
The freight brokers best prepared for 2027 will be those who review core lanes now, establish dependable carrier capacity before it becomes urgent, and prepare customers for changing market conditions.
Waiting for widespread tender failures will be too late.
About AMB Logistic
AMB Logistic helps shippers navigate changing truckload conditions through responsive pricing, dependable capacity coordination, and shipment-level communication.
Every movement is evaluated according to its origin, destination, equipment, schedule, commodity, and operating requirements—not only a national market average.
AMB Logistic supports full truckload, less-than-truckload, expedited, specialized, and time-sensitive transportation.
Ready to pressure-test your 2027 lanes? Connect with AMB Logistic before tighter capacity limits your options.
AMB Logistic
Website: www.amblogistic.us
Email: info@amblogistic.us
Phone: +1 (888) 538-6433
Tags
Truckload Rate Forecast, C.H. Robinson, Freight Brokerage, 2027 Freight Market, Dry Van Rates, Reefer Rates, Flatbed Rates, Trucking Capacity, Route-Guide Failure, Freight Broker Margins, U.S. Logistics, AMB Logistic