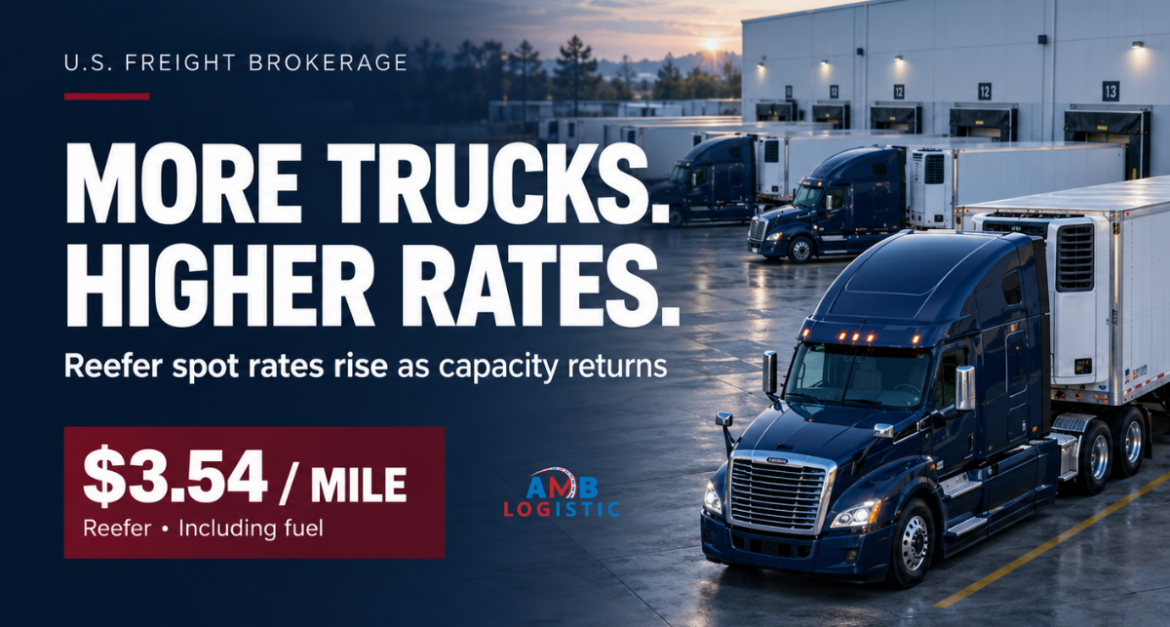
More Trucks, Higher Rates
More trucks returned to the spot market ahead of Labor Day, yet freight rates continued to rise. DAT’s weekly update, published September 8, 2026, shows refrigerated broker-to-carrier spot rates reaching $3.54 per mile, including fuel. For freight brokers, the results highlight an important distinction: improving truck availability does not automatically mean cheaper coverage.
The report covers August 30 through September 5, 2026. It measures the week before Labor Day, rather than market performance after the holiday. That timing matters when evaluating whether returning equipment represents a temporary recovery or the beginning of broader capacity relief.
The brokerage question is practical: when more carrier options appear, how much of that improvement actually reaches the buy rate? Understanding the answer requires separating fuel costs from linehaul pricing and national indicators from individual lane conditions.
What Changed in the Latest Reporting Week?
DAT reported that total load posts declined while equipment postings increased. Nevertheless, average broker-to-carrier spot rates, including fuel, moved higher across dry van, refrigerated and flatbed equipment.
| Equipment Type | Rate Including Fuel | Weekly Change |
|---|---|---|
| Dry Van | $2.95 per mile | Up 6 cents |
| Refrigerated | $3.54 per mile | Up 9 cents |
| Flatbed | $3.54 per mile | Up 4 cents |
Total load posts were down 3% from the previous week, while equipment posts increased 3%. Despite that recovery, total equipment postings remained at their lowest Week 36 level in DAT’s records. Fuel contributed to the all-in increases, while dry van and refrigerated linehaul rates also rose.
These figures describe activity and pricing within DAT’s reported spot-market data. Equipment posts are not a census of every available truck in the United States, and national averages are not guaranteed quotes for individual shipments.
Why More Truck Postings Can Coexist with Higher Rates
At first glance, the combination appears contradictory. If fewer loads are posted and more equipment is available, brokers might expect rates to soften. But several factors influence whether additional postings translate into lower prices.
First, a weekly increase can begin from a very low base. A partial return of equipment may improve the number of options without creating abundant capacity. The market can become easier to cover than the previous week while remaining difficult relative to normal operating conditions.
Second, geography matters. An additional truck in one market cannot necessarily serve a shipment hundreds of miles away at a competitive price. Pickup timing, empty travel and the carrier’s next planned movement all influence whether posted equipment is usable.
Third, operating costs can rise while availability improves. Even when carriers face more competition for a shipment, higher fuel expenses can limit how far they are willing or able to reduce an all-in quote.
The result is a market where brokers may have more conversations and more potential options without seeing an equivalent reduction in coverage cost.
Separate Fuel from the Underlying Freight Rate
The distinction between linehaul and fuel is central to interpreting this update.
Linehaul reflects the transportation charge before a separately calculated fuel component. An all-in rate combines those components and may include other agreed services, depending on how the quote is structured.
If fuel increases, the all-in rate can rise even when the underlying transportation price changes very little. Conversely, a stable all-in rate during rising fuel costs can mean the carrier is receiving less for the linehaul portion of the movement.
For brokers, this creates two separate questions:
- Has the price of securing transportation on this lane changed?
- Has the fuel component changed under the applicable pricing arrangement?
Answering both helps prevent inaccurate comparisons. A fuel-inclusive quote should be compared with another fuel-inclusive quote. A linehaul-only benchmark should not be treated as the total amount required to book a carrier.
This distinction also improves customer communication. A rate increase driven by fuel requires a different explanation from an increase caused by limited equipment, a difficult destination or an urgent pickup.
What the Refrigerated Rate Means for Brokers
The refrigerated headline deserves attention, but the national average should be treated as a market reference rather than a pricing instruction.
Refrigerated shipments require more than a trailer with a cooling unit. Product temperature, equipment condition, loading requirements, appointment windows and transit expectations all affect whether a carrier is suitable.
A posted refrigerated truck may not be available for the required pickup time. It may need to reposition, complete another delivery or satisfy product-specific requirements before accepting the load.
That means the relevant measure for a broker is qualified, available capacity for the actual shipment. A larger pool of listings is useful only when those listings produce carriers that can meet the customer’s requirements.
When comparing refrigerated quotes, brokers should confirm the temperature instructions, operating mode, trailer requirements and any additional services. Differences in the shipment specification can make two apparently similar prices difficult to compare.
National Averages Cannot Replace Lane-Level Pricing
Freight markets do not move uniformly. A national rate can rise while a particular lane softens, or remain stable while another lane becomes difficult to cover.
Origin and destination balance, appointment flexibility, equipment positioning and local demand can all influence the carrier’s decision. The same mileage can produce different pricing when the destination offers fewer opportunities for the carrier’s next load.
Before interpreting more truck postings as a reason to lower a customer quote, a broker should establish whether those trucks serve the relevant lane and pickup window.
A useful review includes:
- Current offers from qualified carriers.
- Recent booked rates for comparable shipments.
- The amount of empty travel required.
- Pickup and delivery appointment restrictions.
- Equipment and product requirements.
- The number of realistic backup options.
This approach turns a broad market signal into a decision grounded in the shipment being quoted.
The Margin Risk Between Quoting and Booking
The period between providing a customer price and confirming the carrier remains a source of brokerage exposure.
A broker may see improving availability and quote a shipment using an expected reduction in the buy rate. If the actual carrier offers remain elevated, the shipment can become less profitable than planned.
Consider a hypothetical load sold for $3,000 with an expected carrier cost of $2,700. The planned gross profit is $300. If the truck is ultimately booked for $2,820, gross profit falls to $180 before brokerage operating expenses.
The $120 increase in carrier cost reduces planned gross profit by 40%. This illustration is not a forecast of market movement. It shows how a relatively modest difference between an estimated and booked rate can materially affect a transaction.
The operational response is to distinguish an estimated rate from a current carrier offer and a confirmed booking. Each represents a different level of certainty.
A Six-Step Brokerage Playbook
1. Refresh pricing on uncovered loads.
Review shipments with an agreed customer price but no confirmed carrier. Prioritize approaching pickups and loads based on older estimates. Check whether the current market still supports the expected buy rate.
2. Compare rates on the same basis.
Confirm whether each quote includes fuel and accessorials. Record the equipment requirements and appointment conditions so that apparent price differences are not caused by different service assumptions.
3. Confirm usable capacity.
Ask whether the carrier can meet the actual pickup window, where the equipment will be positioned and whether it satisfies the shipment requirements. A load-board listing alone does not establish a firm commitment.
4. Set clear validity periods for new quotes.
Where conditions warrant it, state when a new quote expires and when pricing or availability must be reconfirmed. Handle already accepted rates according to the agreed terms rather than assuming they can be changed automatically.
5. Maintain qualified alternatives.
Build backup options for important lanes before the primary carrier falls through. Record which carriers regularly operate the lane and which can realistically respond within the shipment’s time constraints.
6. Review the reason behind every cost exception.
When the final buy rate exceeds the estimate, identify whether the difference came from fuel, urgency, positioning, equipment requirements or a failed carrier commitment. The cause determines what needs to change in the next quote.
What to Watch After Labor Day
The reporting period ended before Labor Day, so the results cannot establish what happened after the holiday. Subsequent data is needed to determine whether returning equipment continues to improve coverage.
For brokers, the next useful signals are whether carrier acceptance improves, whether linehaul prices ease and whether equipment becomes available on the lanes where it is needed.
Watch all-in rates and linehaul separately. If all-in prices remain elevated while linehaul softens, fuel may be masking some underlying relief. If linehaul also remains firm, the improvement in truck availability may not yet be sufficient to change pricing.
Shipment-level experience matters alongside weekly reports. Faster coverage, fewer replacement searches and more dependable carrier acceptance can indicate improvement even before a national average changes substantially.
Communicating the Market to Shippers
Shippers may reasonably ask why a quote remains high when more trucks are being reported. Brokers should explain the difference between a broader availability indicator and the cost of meeting a specific shipment requirement.
A clear explanation identifies the relevant factors: current carrier offers, fuel treatment, equipment needs, appointments and positioning. It avoids using a national average as a universal justification for a price increase.
Where flexibility exists, discuss whether additional lead time or a different pickup window could improve the available options. These changes may help, but the result should be confirmed through actual carrier offers.
Consistent communication between sales, operations and billing helps ensure the customer receives one clear explanation of the agreed service and price.
Frequently Asked Questions
Does more posted equipment mean there is a national truck surplus?
No. Postings measure activity on a particular platform. They do not establish the total number of unique trucks available nationwide or their suitability for a particular shipment.
Does the $3.54 refrigerated average include fuel?
Yes. The reported figure is a national average broker-to-carrier spot rate including fuel for August 30–September 5, 2026. Individual lane quotes can differ.
Why can rates increase when availability improves?
Availability may be recovering from a low base, equipment may be in the wrong locations and operating costs may be rising. More options do not necessarily create lower offers on every lane.
Does this report show conditions after Labor Day?
No. It was published September 8, but its measurement period ended September 5. Post-holiday conclusions require later data.
What should brokers review first?
Start with uncovered shipments, current carrier offers and the distinction between fuel-inclusive and linehaul-only pricing. Confirm that the available equipment meets the actual load requirements.
Final Word
Returning equipment can improve the number of choices available to brokers without immediately lowering the cost of coverage. The important question is whether that equipment can serve the right lane, at the required time, under the agreed shipment conditions.
Freight brokers should use national data to understand the market and current carrier offers to price the shipment. Separating fuel from linehaul, confirming qualified capacity and tracking the gap between estimated and booked rates provides a stronger basis for protecting both service and gross profit.
Talk to AMB Logistic
Planning upcoming freight or reviewing carrier coverage? Contact AMB Logistic to discuss your lanes, equipment requirements, pickup schedules and freight brokerage needs.
Call: +1 (888) 538-6433
Email: info@amblogistic.us
Web: www.amblogistic.us
Tags
Freight Brokerage, Refrigerated Freight, Reefer Rates, Spot Market, Carrier Capacity, Truckload Rates, Fuel Surcharges, Load Coverage, AMB Logistic